BI / Analytics • 2025TableauBusiness IntelligencePricing StrategyData Storytelling
Retail Performance & Discount Optimization Dashboard
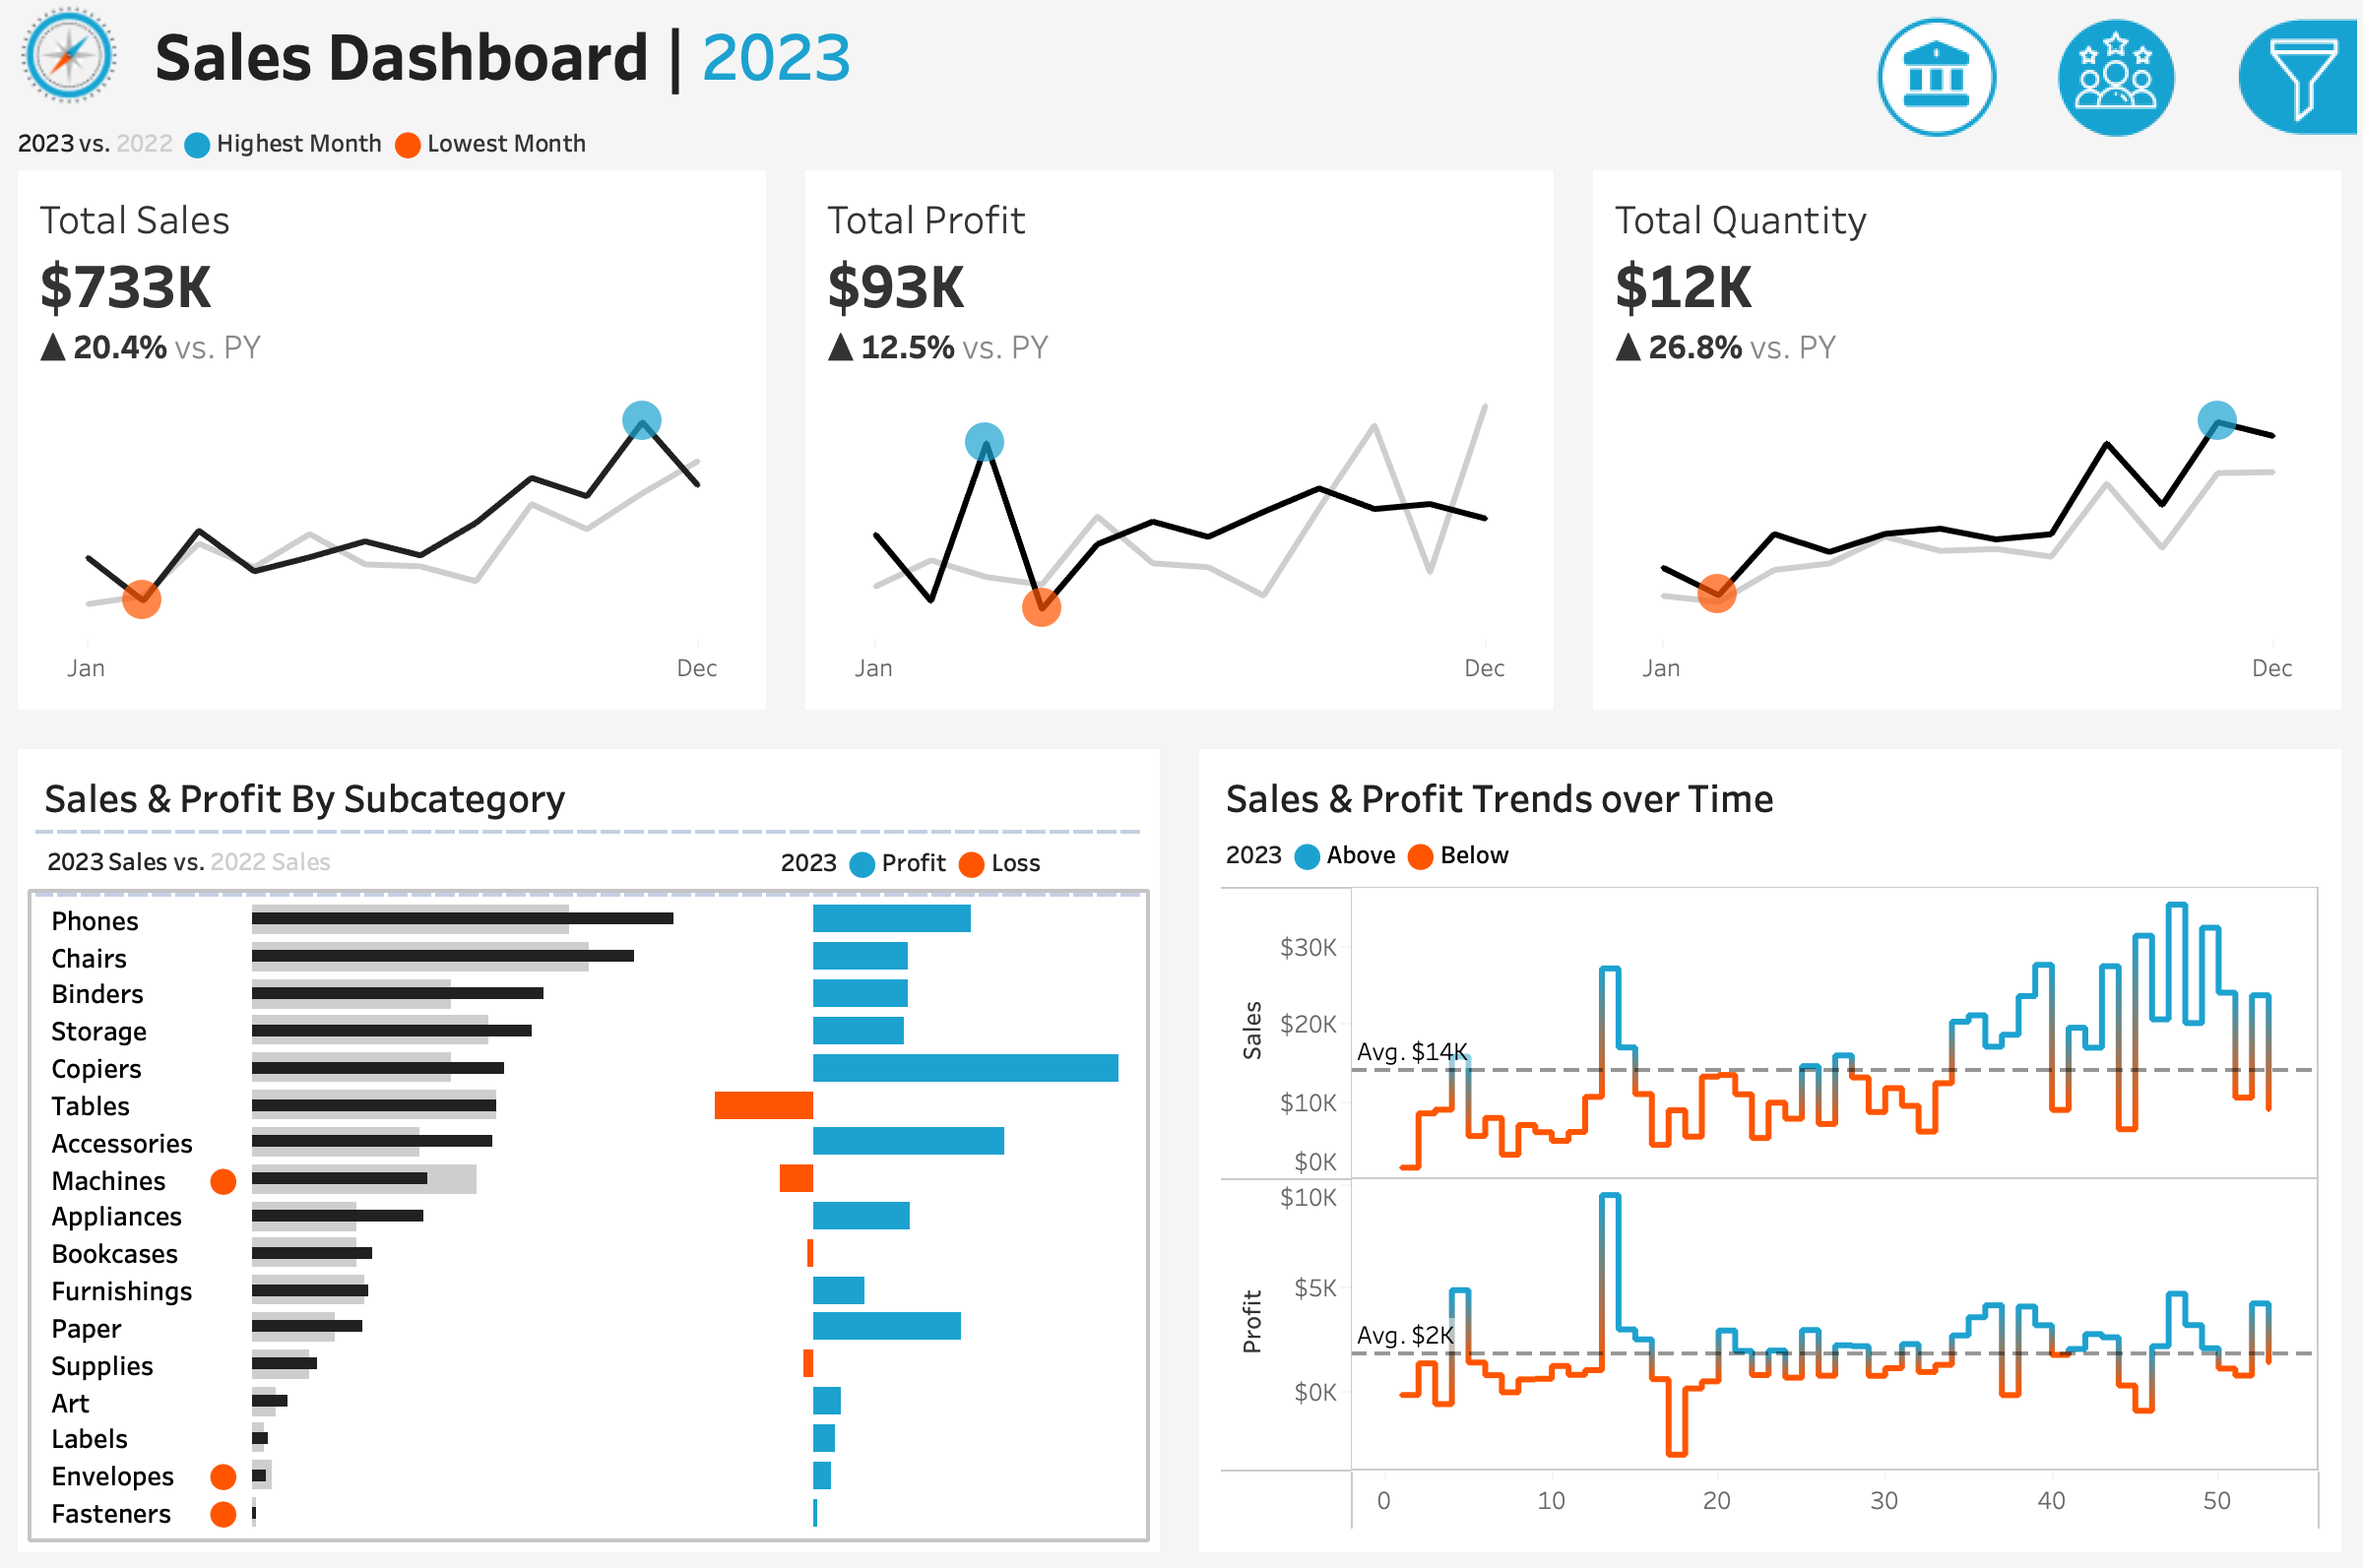
Executive Tableau dashboard analyzing sales, profit leakage, and discount sensitivity across product categories.
Problem
Retail leadership lacked a clear view of how discounting impacted profitability across categories and time. Decisions were made on revenue signals without understanding margin erosion or pricing sensitivity.
Approach
- Built a multi-level executive dashboard showing sales, profit, and quantity trends.
- Designed subcategory-level profitability comparison visuals to detect leakage patterns.
- Created discount sensitivity curves to show where profit collapses.
- Added heatmaps to reveal category-specific pricing risks and discount thresholds.
- Focused layout on executive readability rather than analyst complexity.
Impact
- Revealed categories where discounts drove revenue but destroyed profit.
- Enabled leadership to identify optimal discount ranges.
- Created an executive-ready decision dashboard instead of raw reporting.
- Strengthened storytelling capability around pricing strategy and margin risk.
Tools
TableauData ModelingBusiness AnalysisDashboard UX